Notes: Distributed System Observability - MELT
In this blog, we'll see essential Observability data types i.e. MELT (metrics, events, logs, and traces)

In distributed systems, where we have hundreds of microservices and hundreds of external integrations running on thousands of machines (ballpark numbers), observability gives us the power to see business and technical data in a clear and organized way.
It's important to understand that Observability is different from Monitoring (ref: Observability vs Monitoring).
In this blog, we'll cover MELT, short for metrics, events, logs, and traces. These are the essential pillars of observability. In this blog, I'll cover application side observability concepts only, nothing from the infrastructure side.
1) Events
Events as the term itself suggests - logs events. Events can be any action critical for business e.g. when somebody initiates adding items to a cart, or they add new items to an existing cart, or they initiate the payment, or they complete the payment, etc.
It's important to understand that an application can generate way more other kinds of events to be used by the dev team like clicking a button or clicking on the search bar. These events may not be critical for the business but can be used by tech to initiate some processes like autosuggestions on clicking on the search bar. These kinds of events we usually push as logs, which we'll cover later.
Tech can use business-critical events as well usually to run some async work like search indexing products when a new product is added or updated, or updating the cart in the cache when the cart changes.
We can pass events in some format for the observability tool to understand. JSON format would be suggested though as it's the most used standard now. We can also persist these in databases, but I'd suggest using tools created specifically for observability like New Relic which I prefer personally.
Events can contain EventType, Timestamp, Message, and other additional attributes as per the requirement e.g. Amount Paid, Payment Type, Client Geography, etc. An example event data point can look something like this:
{
    "EventType": "PaymentSuccess",
    "Timestamp": "2018-02-21 12:00:00",
    "AmountPaid": 50.55,
    "PaymentType": "UPI",
    "ClientGeography": "UK",
    "Products": [
        {
            "ID": "B008XT42JU",
            "name": "Power Strip with Master Switch",
            "price": 23.45
        },
        ...
    ]
}
2) Metrics
Metrics in simple terms are the aggregation of Events data. For example, you can get the total amount paid in the last one hour by querying EventType = PaymentSuccess and Timestamp within one hour. Similarly, we can move Timestamp to get different sets of values. We can calculate total, average, maximum, minimum of AmountPaid. We can filter based on ClientGeography.
Overall, we can do n number of things as per our requirements. Metrics are the concrete data that is used by the business to understand performance. Events are single data points that don't give any logic individually. We can project Metrics as JSON but remember that we don't pass metrics anywhere. It is just an aggregated output of events. This JSON is just for understanding the data points.
MetricName is the identifier.
{
    "MetricName": "PaymentStats",
    "Timestamp": "2018-02-21 12:00:00",
    "Count": 45,
    "TotalAmount": 2699.5,
    "AverageAmount": 25.45,
    "NumOfClientGeographies": {
        "UK": 10,
        "US": 15,
        "IND": 25
    },
    "NumOfPaymentTypes": {
        "UPI": 100,
        "CreditCard": 14,
        "Others": 26
    }
}
Other important business metrics examples can be customer sign-ups, bounce rate, cart abandonment, etc.
3) Logs
Logs are usually created by developers to log the events. These events as I mentioned in the Events section are not useful for business but useful for developers. Logs are generally used by devs to troubleshoot the application. Logs are extremely valuable for troubleshooting databases, caches, load balancers, or older proprietary systems that aren’t friendly to in-process instrumentation.
Logs are more granular than Events. We can have multiple logs leading to a single Event.
Logs usually are divided into levels. Most used levels are debug, info, warn, error and fatal.
Debug is used while debugging the code. It is usually coupled with the environment e.g. debug log will show only in "dev" environment. Debug log may contain values that shouldn't escape in prod in any condition e.g. it can be used to track request-response of API in real-time.
Request:
{"env": "dev", "service": "payment-service", "version": "1.4.2", "level": "debug", "requestId":"1656176711319:1001", "method":"GET", "path":"/payment-status", "params":{}, "query": {"id": "pay_326", "country": "UK"}, "payload":{}, "message": "request", "timestamp": "2022-06-04T03:56:54.593Z"}Response:
{"env": "dev", "service": "payment-service", "version": "1.4.2", "level": "debug", "requestId":"1656176711319:1001", "method":"GET", "path":"/payment-status", "status": 200, "response": {"status": 1, "paymentMethod": "UPI", "timestamp": "2022-06-04T01:50:54.593Z"}, "elapsed": "670ms", "message": "response", "timestamp": "2022-06-04T03:56:54.593Z"}
Info is another important log type. Info gives information about different important steps in a process.
{"env": "dev", "service": "payment-service", "version": "1.4.2", "level": "info", "message": "RABBITMQ connection successful", "timestamp": "2022-06-04T03:56:54.593Z"}
{"env": "dev", "service": "payment-service", "version": "1.4.2", "level": "info", "message": "redis connection closed", "timestamp": "2022-06-04T03:56:54.593Z"}
Warn is used mostly to warn about something which has the potential to create issues or errors in the future.
{"env": "dev", "service": "payment-service", "version": "1.4.2", "level": "warn", "message": "warehouse details not available. using global config as fallback.", "timestamp": "2022-06-04T03:56:54.593Z"}
{"env": "dev", "service": "payment-service", "version": "1.4.2", "level": "warn", "message": "Kafka close signal received for topic INVOICE_GENERATION", "timestamp": "2022-06-04T03:56:54.593Z"}
Error is used to send errors encountered by the system. It could be a failure of external systems.
{"env": "dev", "service": "payment-service", "version": "1.4.2", "level": "error", "requestId":"1656175916246", "method":"GET", "path":"/wrong-turn", "response": {"statusCode": 404, "payload":{"code": -1, "error":"Not Found","message":"page not found"}}, "message": "Not Found", "timestamp": "2022-06-04T03:56:54.593Z"}
{"env": "dev", "service": "payment-service", "version": "1.4.2", "level": "error", "error": {"stack": "Error: timeout of 5000ms exceeded\n at Function.throwError (/Users/kshitij/services/payment-service/src/utils/service-caller.js:15:19)\n at ...)", "message": "timeout of 5000ms exceeded", "microservice": "config", "code": -3}, "message": "configuration initalization failed", "timestamp": "2022-06-25T02:17:50.254Z"}
Fatal is the most severe one as it has the potential to terminate the whole application or initiate server restart.
{"env": "dev", "service": "payment-service", "version": "1.4.2", "level": "fatal", "message": "server start failed, port :8080 already in use", "timestamp": "2022-06-04T03:56:54.593Z"}
Log can also be used to track step by step progress of a process e.g.
6/21/2022 15:33:14: user pressed the "checkout" button
6/21/2022 15:33:17: checkout called payment service to initiate payment for $23.5 via "UPI" method
6/21/2022 15:33:17: ERROR: payment service timed-out
6/21/2022 15:33:17: Payment failed, redirecting back to the checkout page
This kind of logging is extremely helpful in critical places and it can show us the exact reason for an issue and required metadata to debug and work on a fix.
4) Traces
Traces are chains of events that occurred in a transaction e.g. showing which services were invoked, which instances they were running on, and what the results of each call were. Sevices can include internal services, external services, databases, cache, etc.
The trace data helps you understand the flow of requests through your microservices environment and pinpoint where failures or performance issues are occurring in the system, and why.
A distributed trace has a tree-like structure, with child spans that refer to one parent span. This diagram shows span relationships in a trace (New Relic):
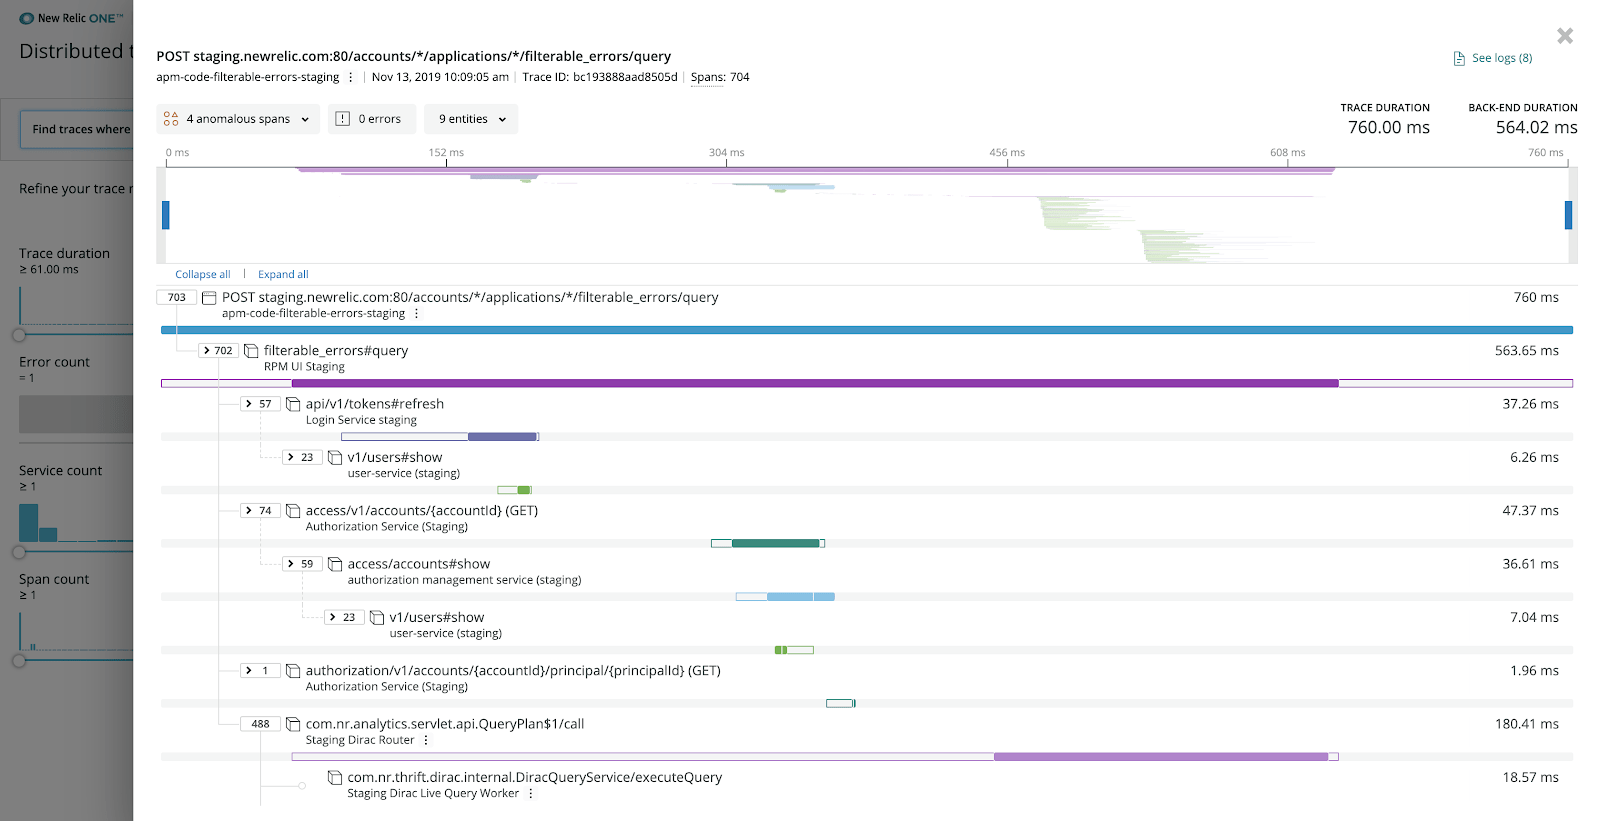
A practical trace data can look like this:
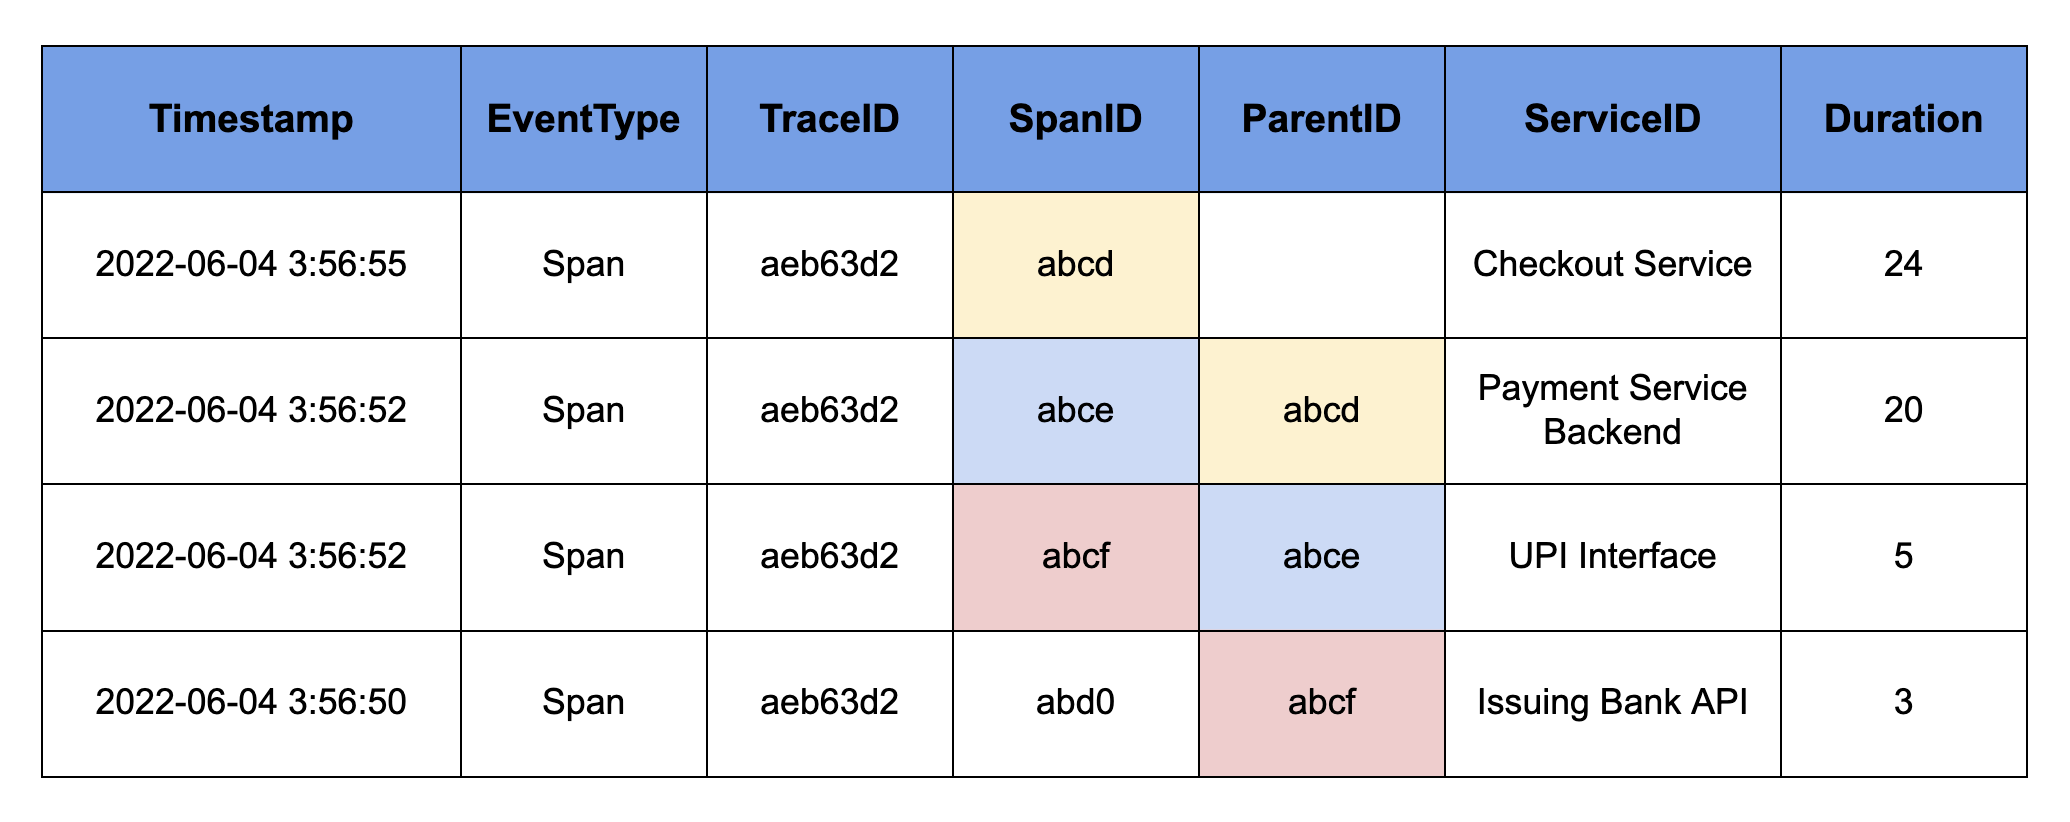
Here you can see a subsection of tracing. Checkout Service would've initiated a payment, which called payment Issuing Bank API, which then called UPI payment method related service, which called Issuing Bank API. This builds a call stack for us. Now the execution starts from the top of the stack from Issuing Bank API to the Checkout Service.
You can notice here that Payment Service Backend is taking around 15 units of time while others are taking just 3 units, 2 units, and 4 units only. So, if something goes wrong with this API, we know that we have to look at Payment Service Backend first, and usually, we catch issues directly like this only. Rarely issues are hidden from something obvious like this.
It's important to understand terminologies here:
- Span is a special EventType used for tracking events for tracing.
- SpanID is a unique identifier associated with each Span event.
- TraceID is a unique identifier for the whole transaction. Span events in the same transaction will have the same TraceIDs.
- ParentID is the SpanID of the parent Span of current Span (basically child Span).
- ServiceID is an identifier of the service (external or internal).
- Duration is the cumulative time taken to the completion of that step.
- Timestamp is the timestamp when that step ends and returns to the next step.
Attributes of tracing may change from platform to platform so it's not a fixed pattern. Users can add their own custom attributes as per the requirements and availability of features on the tracing platform.